2023 EDI in interim management industry report
Comparative analysis of protected characteristics amongst the interim management community, Practicus candidates and the general population of the UK
Report

Charlotte Whitehouse
As an interim management provider, it is essential for us to have an inclusive approach to talent – ensuring the very best expertise for our clients.
However, when it comes to Equality, Diversity and Inclusion (EDI) for candidates in our own industry there is not much data openly available.
It is an issue we care about – and one where we actively play some role through our own business practices – so this left us wondering:
- How good is the representation of protected characteristics in interim management?
- And how do our own placements of interim managers compare?
This is important, not just to us but quite clearly to candidates themselves and increasingly clients too. Given the interest in this matter as well as our own desire to further investigate candidate diversity, we commissioned a survey of all the candidates we placed in 2022.
The survey covered protected characteristics such as Ethnicity, Age, Gender, Sexual Orientation, Disability and Religion/Beliefs. We have used its findings for comparative analysis between the available industry data, the general population’s characteristics and our own interim management services.
The results are set out below.
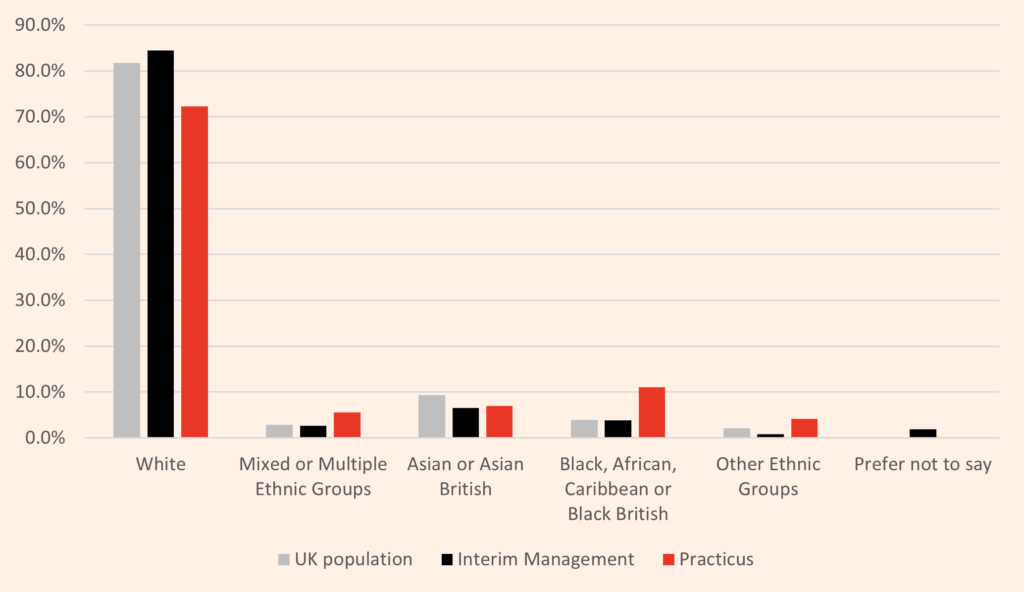
Ethnicity in interim management
| Ethnicity | UK Population | Interim Management | Practicus |
|---|---|---|---|
|
White |
81.7% |
84.4% |
72.2% |
|
Mixed or Multiple Ethnic Groups |
2.9% |
2.6% |
5.6% |
|
Asian or Asian British |
9.3% |
6.5% |
6.9% |
|
Black, African, Caribbean or Black British |
4.0% |
3.8% |
11.1% |
|
Other Ethnic Groups |
2.1% |
0.8% |
4.2% |
|
Prefer not to say |
0.0% |
1.9% |
0.0% |
Industry data around ethnicity in interim management is hard to find. Perhaps the best source of data is provided by the Institute of Interim Management, which conducts a survey of several thousand interims in the UK every year. Even so, the survey’s collection of data around ethnicity only began as recently as 2021. It shows that interim management skews more “white” than the UK general population as a whole.
In 2022 according to the survey, UK interim managers were 84.4% white, compared with a UK general population that is 81.7% white (according to the Census 2021). This is a difference of 2.7 percentage points. And due to it, all other ethnic groups make up a lower proportion of the industry than they do in the general population. These differences are seemingly small (less than three percentage points in any one ethnic minority when compared with the UK overall) but they do nonetheless exist. The largest of these disparities is among “Asian and British Asian” ethnicities, where the industry is 2.8 percentage points behind the proportion in UK society overall.
How does Practicus compare?
By comparison, Practicus’s 2022 survey of its own placements shows greater representation of ethnic minorities. A number of these ethnic groupings make up a larger proportion of Practicus candidates than you would expect to find in the population as a whole based on 2021 census data. The largest of these groupings was “Black, African, Caribbean or Black British”, which makes up 4% of the UK population but 11.1% of Practicus placements in 2022.
There were two under-represented groups. The first was “White” at 72.2% which, while 9.5 percentage points lower than in the general population, still made up the vast majority of Practicus placements. The second was, “Asian or British Asian”, which as we saw with the industry data is lower than the overall makeup of the UK. To put that in context, 6.9% of Practicus placements were “Asian or British Asian” against a general population proportion of 9.3%. This is a difference of 2.4 percentage points. Compared with the data from the interim management industry for “Asian and British Asian” discussed earlier, Practicus is slightly better by being closer to the general population by 0.4 percentage points.
Age and interim management
| Age | UK Population | Interim Management | Practicus |
|---|---|---|---|
|
20 – 29 |
12.6% |
0.4% |
2.8% |
|
30 – 39 |
13.6% |
5.4% |
11.8% |
|
40 – 49 |
12.7% |
18.8% |
29.9% |
|
50 – 59 |
13.7% |
47.6% |
38.9% |
|
60 – 69 |
10.7% |
26.6% |
16.7% |
|
70+ |
13.6% |
1.1% |
0.0% |
Interim management as an industry skews older than the UK general population.
According to the IIM survey 2022, an interim manager is far more likely to be in their 50s or 60s than all the other age groups combined.
This is a historical trend that can be found in IIM data as far back as 2011 and is likely a consequence of the nature of the industry where interims are typically required to have had prior experience in senior or specialist positions before moving into the profession (see interim management skills needed).
How does Practicus compare?
Practicus candidates in the 2022 survey tend to be slightly younger when compared to industry data, and were most likely to be in their 40s and 50s. Practicus also had greater representation in younger age categories (40-49, 30-39 and 20-29) than the wider interim management community, alongside less representation in oldest categories (60-69 and 70+). Overall, Practicus candidates still skewed older when compared to the general population.

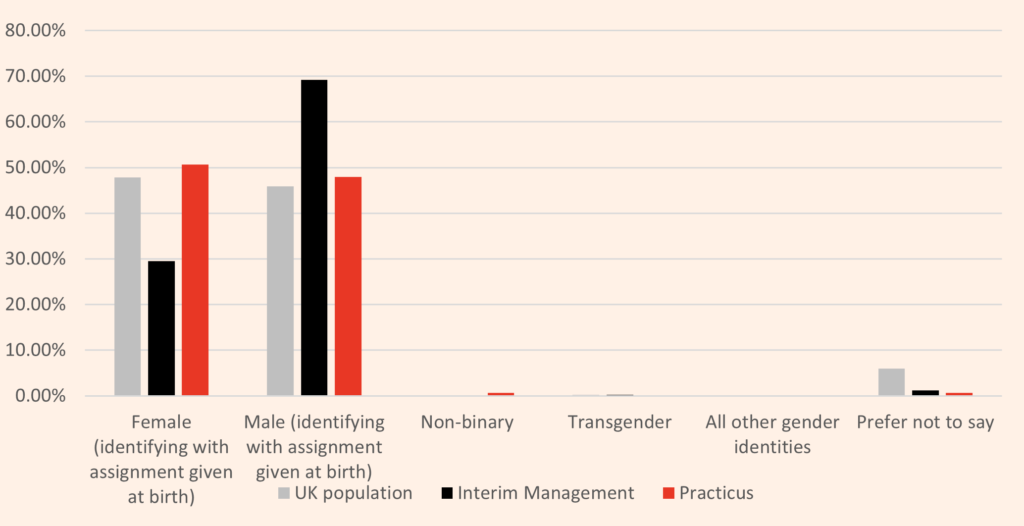
Gender and interim management
| Gender | UK Population | Interim Management | Practicus |
|---|---|---|---|
|
Female |
47.83% |
29.5% |
50.7% |
|
Male |
45.87% |
69.2% |
47.9% |
|
Non-binary |
0.06% |
0.0% |
0.7% |
|
Transgender |
0.20% |
0.2% |
0.0% |
|
All other gender identities |
0.04% |
0.0% |
0.0% |
|
Prefer not to say |
6.00% |
1.2% |
0.7% |
As a cohort, interim managers are considerably more likely to be “Male” when it comes to gender.
In 2022, the IIM reported that 69.2% of the interim community is male, some 23.3 percentage points above the proportion of males in the general population according to the 2021 Census.
Despite the Institute of Interim Management reporting one of the highest ever years for “Female” interims in its 2022 annual survey, the proportion was still just 29.5%, up from below 25% in the two prior years. This compares to a general population of 47.83% “Female”, meaning there is an 18.3 percentage point difference between the industry and the general population.
The IIM also collects data around other gender identities and 0.2% of respondents in the 2022 survey indicated “Transgender”, which reflects the general population in the findings of the 2021 Census.
How does Practicus compare?
The survey of Practicus candidates placed in 2022 revealed that 50.7% of our placements were “Female”, with 47.9% of responding as “Male”. This tracks more closely with the UK population overall and represents a significant difference with the industry. It is perhaps one of the biggest takeaways from the survey.
The survey looked at other gender identities as well and shows that Practicus candidates were slightly above the population in representation of non-binary individuals but slightly lower on Trans.
A note of caution is needed on minority gender identities, however. While the Practicus survey, IIM survey and 2021 census all provide data on this area, it is hard to draw conclusions with the percentage point differences between the sources being less than 1%. Combined with the much smaller data sample sizes of the IIM survey and the Practicus survey, the cumulative result is that the differences may not be statistically significant. We will look to monitor gender over repeat surveys to identify potential trends.
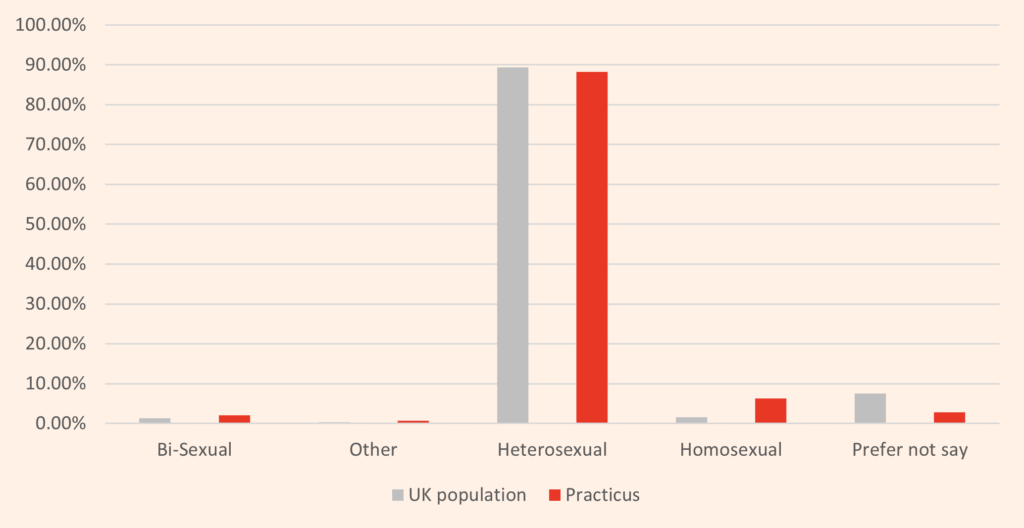
Sexual Orientation and interim management
| Sexual orientation | UK Population | Interim Management | Practicus |
|---|---|---|---|
|
Bi-Sexual |
1.28% |
– |
2.1% |
|
Other |
0.34% |
– |
0.7% |
|
Heterosexual |
89.37% |
– |
88.2% |
|
Homosexual |
1.54% |
– |
6.3% |
|
Prefer not to say |
7.47% |
– |
2.8% |
While no interim management industry data could be found on sexual orientation for comparison, we did go ahead and compare our survey results with those of the general population.
The percentage of “Heterosexual” candidates placed by Practicus in 2022 was 88.2%. This corresponds closely with the 89.37% reported in the 2021 UK Census, albeit 1.2 percentage points under.
All other sexual orientations in our survey were higher proportionately for Practicus candidates than the level of incidence in the population. For example, the survey suggests that a Practicus candidate is more likely to be “Homosexual” than the general population (6.3% Practicus, 1.54% Census).
However, there is a caveat. It must be taken into account that responses on sexual orientation in the 2021 Census had one of the highest incidences of “Prefer not to say”, with 7.47% of people choosing that option. This compares to just 2.8% “prefer not to say” in the Practicus survey. This may account for the differences among minority orientations when compared with the Census data.
Disability and interim management
| Disability | UK Population | Interim Management | Practicus |
|---|---|---|---|
|
Don’t know |
– |
– |
0.7% |
|
No |
80% |
– |
88.2% |
|
Yes |
20% |
– |
9.7% |
|
Prefer not to say |
– |
– |
9.7% |
While no interim management industry data could be found on disability for comparison, we did compare our survey results with data on disability in working age people in the UK. We used reporting by the Department for Work and Pensions to do this. According to that data set, roughly 20% of the working-age population has at least one disability.
Incidence of disability amongst the interims placed by Practicus in 2022 was 9.7%, 10.3 percentage points lower than the country’s working age population.

The disabilities indicated in the Practicus survey by order of greatest frequency were:
- Reduced physical capacity
- Hearing impairment
- Learning disability
- Mental ill health
- Physical coordination difficulties
- Autism
- Progressive conditions
- IBS
- Long Covid
- Long-standing back complaint
* Please note: disabilities and difficulties are different. For completeness and full transparency, we have included all conditions indicated in responses to this question from our survey, whether they are classed as a disability or better described differently as a difficulty or other condition.
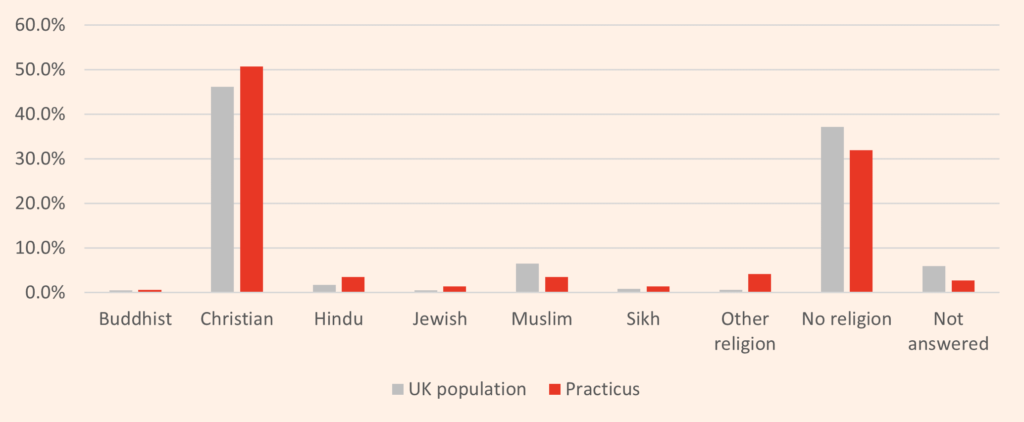
Religion and beliefs in interim management
| Religion | UK Population | Interim Management | Practicus |
|---|---|---|---|
|
Buddhist |
0.5% |
– |
0.7% |
|
Christian |
46.2% |
– |
50.7% |
|
Hindu |
1.7% |
– |
3.5% |
|
Jewish |
0.5% |
– |
1.4% |
|
Muslim |
6.5% |
– |
3.5% |
|
Sikh |
0.9% |
– |
1.4% |
|
Other religion |
0.6% |
– |
4.2% |
|
No religion |
37.2% |
– |
31.9% |
|
Prefer not to say |
6.0% |
– |
2.8% |
Again, there is no data on religion and belief amongst the interim management community as a whole. Nonetheless, we compared the results of the survey we commissioned of Practicus candidates with the 2021 Census data.
It revealed that religious beliefs amongst candidates placed by Practicus are highly diverse. The results track closely with religious beliefs in the population overall but with a few notable differences.
Firstly, Practicus placements were less likely to have ‘No religion’ than the general UK population, a difference of 5.3 percentage points.
Secondly, while the most common answer given in both the 2021 Census and the 2022 Practicus survey was “Christian”, the answer was 4.5 percentage points higher amongst Practicus placements.
Thirdly, all other forms of religious belief were more common amongst Practicus candidates than the general population – including Hinduism, Judaism and Sikhism – with the exception of Islam, which was 3 percentage points lower than adherents in the general population.
About the data sources used in this analysis
Practicus data source
The survey of Practicus 2022 placements had a 35.35% response rate by candidates. Data collection was anonymized to prevent profiling and other concerns highlighted by candidates and EDI experts in preparatory research. Tools were used to ensure individual responses cannot be extracted from the overall data set that Practicus received in order to prevent ‘jigsaw identification’.
Industry data source
Industry data sources for interim management are few in number and those that do exist are largely incomplete on the subject of protected characteristics. However, the Institute of Interim Management’s (IIM) survey is a well-respected source that has been collecting data for over 10 years. While its survey does not cover every protected characteristic, it is nonetheless the best we are aware of. Consequently, we have used the IIM’s 2022 Survey report as our main source of industry data.
General population data sourceS
For the general population data source, we used the recently released 2021 Census Data. While not for the year 2022 specifically (the census only takes place every 10 years), the census provides a gold standard for data on the UK population, providing both the highest quality and most appropriate source of data for comparison for our purposes.
However, there is one exception. While the Census does cover disability, it does not provide equivalent data for comparison with our own survey. For this reason, we used the Department for Work and Pensions data that provides its disability dataset in a form that allows direct comparison. This dataset just covers the working-age population, which in many ways is more useful for analysis in the context of this report.
END
MORE ON INTERIM MANAGERS

Relevant Practicus services:
Resources:
- What is an interim manager?
- Interim manager meaning
- What is an interim manager role?
- Interim management skills needed
- What benefits interim manager?
- ROI of an interim manager
- Executive interim management
- Interim Management Client Guide
- Interim Management Candidate Guide
- Interim management in a time of COVID-19
- IR35, what it means for Interim Managers
Looking to maximise the talent available to your organisation?
Equality, Diversity and Inclusion
Practicus has a strong commitment to Equality, Diversity and Inclusion (EDI). We have implemented policies and practices that promote EDI throughout our organisation, with a dedicated team to support it.

If you would like to find out more, feel free to contact our EDI team at edi@practicus.com