Making Data Count to Tackle Health Inequalities
Redefining patient pathways presents an opportunity to focus on improving outcomes for historically underserved communities
Written by Practicus in conjunction with Keith Burnett, Health and Social Management Consultant and Change Management Specialist in the Healthcare industry.
(NHS England has identified a number of Priorities for 2022/23 for healthcare organisations to focus on. Here is the first article in a series taking a deeper look at some of the challenges and potential ways forward these priorities point to, on this occasion addressing the relationship between tackling health inequalities and managing the nations’ health proactively).
Although the stark disparities between health access and outcomes experienced by parts of the community are not news to anyone who works in health and social care, the legislation and guidance emanating from NHS England underlines a change of emphasis; policy-makers of all political hues are now starting to take inequalities seriously. Occasional attempts to rebrand inequality as ‘disparities’ have not masked the growing gaps which, in some cases, the pandemic experience has widened; naturally, responding is now high on the list of NHS priorities, at national and local level.
1. The Health Inequalities Fault-Line
It might seem a statement of the obvious to point out that deprived areas fare worse than more affluent ones, but we need the data to show it. Contrast the prospects of a child born in Westminster today to the child born in Blackpool, who has a higher chance of suffering two decades more of ill-health and dying a decade before their London counterpart. Based on analysis by The King’s Fund, using ONS data, these findings are hardly marginal. In another report, the King’s Fund analysed the burgeoning post-Covid elective care waiting list of nearly 6m people requiring hospital treatment in England, an increase of 44% compared to a year earlier. Its research concluded that people in the most deprived areas were nearly twice as likely to wait over one year for treatment compared to the less deprived; a gap which many working in the system suspected, but is only demonstrable through the good data management of the NHS itself.
Addressing health inequalities is again becoming a high-priority challenge at national level – and as a society, the growing divergence in rich-poor life expectancy should arguably concern us all. The data suggests that differences in income, lifestyle factors, and different rates of uptake of preventive health services (and treatment rates for diseases), go a long way together to explain the life expectancy differences. Those gaps take a human toll, and place a commensurate burden on the public finances in two related ways:
- The extra cost on the NHS is estimated at £4.8 billion a year as a result of greater use of hospitals by people in deprived areas.
- Reduced employment and productivity and higher welfare costs as a result of poor health affecting people’s ability to work, was estimated at £33bn and £20bn respectively in the original Marmot report (Fair Society, Healthy Lives 2010).
Health inequalities have been occupying the minds of many care professionals for decades, albeit with fluctuating interest from the centre. Now, with the demonstrable impact growing, calls for more equitable prevention of illness are getting louder.
There remains a challenge for any planner to find ways to work across organisations and establish a shared set of workable indicators that will enable it to target additional resources for maximum impact.
2. What causes health inequailities
It’s all too easy to resort to blame and assume that inequality exists because people smoke too much, drink too much, eat poorly and don’t take enough exercise – but of course the reality is more complex than that. Our health is determined by a wide range of factors including genetics, lifestyle, the health care we receive and the impact of wider ‘determinants’ such as social norms and economic freedom to act. This is still well-illustrated by the seminal Dahlgren and Whitehead diagram, indicating the interacting spectrum of causal factors.
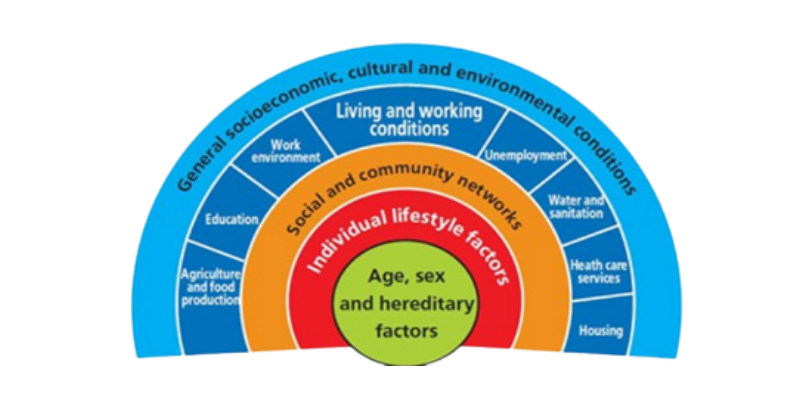
The model, developed by Göran Dahlgren and Margaret Whitehead in 1991,
maps the relationship between the individual, their environment and health.
There remains a challenge for any planner to find ways to work across organisations and establish a shared set of workable indicators that will enable it to target additional resources for maximum impact.
3. Bridging the Gap – a Policy Priority
To show the efficacy of inputs intended to reduce health inequalities, in a way which policy-makers can take on board, we need to show how intelligent use has been made of available data to plan, manage and target health services to meet the population’s needs. The NHS cannot reverse these inequalities on its own. Indeed, to prevent the gap widening, there needs to be a better understanding of the fundamental causes of inequality.
As potential starting points, the DHSC has set up a new Office of Health Improvement and Disparities (OHID) with the identified purpose of tackling health inequalities across the UK, while NHS England has appointed a Director of Health Inequalities to champion the issue in a comparable manner to health leaders in the semi-devolved administrations. These could become signals of commitment to tackling this issue.
A further sign of health inequalities becoming a central concern is the increasing reference to what is now termed Population Health Management. The discipline behind it is worth borrowing from, requiring as it does data-based intelligence and actionable insights to address the combination of factors pertinent to health. The NHS Long Term Plan, too, aims to meet population needs by looking not only at hospital-based care but the also the whole range of preventive healthcare which could fall under the ambit of integrated care systems (ICSs), working with individuals, communities, government and businesses. This approach improves understanding about who needs the most help and where to direct resources effectively.
4. Health Inequalities seen through the Lens of Smoking and Obesity
As anyone who has been involved in public health will tell you, a glance at local smoking and obesity and a comparison with a neighbourhood map always draws the eye to strong systemic relationships between deprivation and these two primary causes of preventable death and disease. According to data quoted by the NHSE Director of Inequalities in an HFMA article, 27.2% of mortality from cardiovascular disease under the age of 75 is among people in the 20% most deprived communities, and 41.5% of avoidable mortality from chronic respiratory disease is again represented in that 20% most deprived. In addition, people who live in deprived regions of England are not only more likely to have long-term health problems, but are likely to find it even more difficult to see a GP and experience worse care when they see a GP.
This aspect demonstrates how disadvantage accumulates for some people leading to poor health and early death. Until recently, data showed smoking to be the biggest root cause of avoidable deaths in the UK, accounting for 77,500 deaths in 2016, and costing the NHS approximately 2.5 billion annually, which included half a million hospital admissions. It’s still one of the biggest, but a recent study by Glasgow University and published by BMC shows obesity overtaking smoking’s lead role in causing preventable deaths among older people, with the cross-over taking place in 2013.

BMC (Biomedicalcentral) Blog
In some lights, there’s a good news story here. Joined-up tobacco control strategies which got going twenty years ago had a tangible effect, with the quarter of the UK’s adult population smoking then falling to 14.1% in 2019. Meanwhile, with less co-ordinated intervention, obesity rates have been rising, from 15% in England in 1993 to 28% in 2019.
Obesity is a growing concern – forgive the old pun – not for aesthetic reasons but because it results in a higher incidence of life-threatening health conditions such as diabetes, cardiovascular disease, stroke, hypertension, and certain cancers. The scale of the problem can be seen in the rise in hospitalisations, recorded by NHS Digital. In 2019/20 there were more than 1 million hospital admissions linked to obesity in England, an increase of 17% on the previous year. As well as increased mortality the results are notable in terms of increased morbidity; we’re not just dying earlier than we need to, but our final years are disturbed by ill health and discomfort. The human, as well as the financial, cost touches us all.
The increase in obesity among children is particularly alarming, given the tendency of childhood obesity to lead to lifetime obesity. Children in the most deprived communities are around twice as likely to be obese as those in the most affluent. For example, in 2017, in the reception year, obesity among children was highest in Wolverhampton at 14% and lowest in Kingston upon Thames at 5%. In Year 6, it was highest in Barking and Dagenham at 29% and lowest in Rutland at 11%. No-one would suggest that this is fair, but experience has shown that only marshalling the data can make the case for the sustained, enduring action required in order to make a difference.
5, Using Data Better to Prevent the Preventable
It’s something of a truism that good quality data is key to helping the NHS achieve improvements in patient care and patient safety; everyone understands that this is a complex system and that all the dials on the dashboard have to be working to assess what’s happening. Access to the right data and the appropriate means of interpreting it are just as crucial to the fight against health inequalities and avoidable killer diseases too, though. With smoking and obesity what’s often needed is more ‘upstream’ policies which can create the environment for good health, not just deal with the consequences of poor health.
Smoking
At the time of writing, there is a stated ambition for England to be functionally smoke-free by 2030 with an adult prevalence of 5% or less – roughly where snuff was a century ago (and who even encounters that now?). In principle, it’s achievable, with only 14% of the population still smoking today, the majority of this 6 million or so people living in deprived urban centres. But any solution which makes that much difference in so short a space of time will have to be done with communities, not done to them, and the data shows what the difference looks like in practice.
According to ASH only 5% of smokers successfully quit each year, in spite of the taxpayer funding Stop Smoking Services since 2001. Twenty years at 5% per annum would have completely eliminated smoking if those selling tobacco had not benefitted from ‘replacement smokers’ joining the market, so the race is on. In 2020, the year Covid-19 first raged, results were more promising. Four weeks after completion those who self-reported to have quit rose to 58%, but this was only confirmed by carbon monoxide validation in 32% of cases. The average in previous years had been 53% self-reported after four weeks, dropping to only 15% of quitters verified by carbon-monoxide monitoring a year later. That suggests a high number of quitters after four weeks who then struggled to sustain their progress – as is completely normal in addiction recovery. If the variable had been chosen with greater insight from those who use the services, we could have data which tells us much more about how interventions can best be planned and targeted.
Obesity
Diet and physical inactivity are the principal behavioural risk factors contributing to obesity; as any dietician will tell you, if more calories go in than you can burn off, you’re going up a size before you know it. These twin factors can be addressed by working with individuals to change behaviours, but too often these initiatives fail if the individual’s environment and socio-economic conditions influencing their choices are not also addressed. To put this into perspective with reference to one of the pairs of places above, Rutland has so little fast food available that it was reportedly the last county town in England to receive a pair of ‘golden arches’, while there are parts of Barking where fried chicken is said to be easier to find than fresh fruit. Few children have the opportunity to graze beyond their route from home to school, so town planning and advertising controls may be just as important as ‘educating’ parents.
To date, the NHS approach to tackle obesity has been less joined-up than anyone working in the field would recommend, and largely focused on information to change individual behaviours. Looking at the data, the case for a much broader approach is undeniable, but some ministerial reluctance to tax and regulate firms with big lobbying budgets is also to be anticipated. The ‘polluter pays’ principle is justified, but still only tends to win the argument when the data is unambiguous about the need to put it into practice. It is possible to get there, however, as we are now reminded almost every budget day when taxes on tobacco products rise faster than inflation; no-one would suggest, these days, that this is anything other than a reasonable response.
6. If health inequalities are the problem, is population health management the solution?
There’s a lot of talk at the moment about population health management (PHM) as a means to address inequalities earlier, and at the source. Whether the language of ‘PHM’ survives the political cycle remains to be seen, but the concept of designing health service and other interventions together, guided by the needs of specific local populations, is likely to remain a central aim of the Integrated Care Service programme – which itself has a fairly high likelihood of enduring beyond the forthcoming general election. The most advanced ICSs are already using the potential of data analytics to gain a better understanding of what the social determinants of health mean in practice for the communities they serve.
PHM essentially aims to improve the health of a community by data-driven planning and delivery of interventions to achieve maximum impact. It includes segmentation and impact modelling to identify local at-risk cohorts. Targeted services and interventions are then, in theory, designed to prevent ill-health and to improve care and support for people with ongoing health conditions. To effectively address the problem of health inequalities could require prioritisation of specific groups within existing budgets or it could initially lead to increased costs as the service responds to previously unmet demand. Either way, this will be challenging given tight finances and a daunting backlog of activity following the worst of the Covid pandemic.
PHM is one response to the recognition that health budgets are struggling to keep pace with demands. At its core is the idea of using health-system data to find out what appears to work, and then do more of it. If a certain kind of medicine, treatment or technology cures more people than another, so the argument goes, do more of that. It’s seductively simple, which is part of its attraction – but of course human behaviour change is often anything but. There will be interesting challenges ahead to incorporate more of the qualitative data about what appears to work from the patient’s perspective, and an ICS which gets that right will truly have an advantage.
Core20PLUS
The query for many health systems across the country will be knowing where to start. One possible way in is presented by the Core20PLUS5 concept, which proposes reduction of health inequalities through focusing on:
- Core 20 — the most deprived 20% of the population identified by the Index of Multiple Deprivation (IMD)
- PLUS– additional groups experiencing poor health access, based on ICS population health data
- 5–the five clinical areas requiring accelerated improvement and identified in the 2021/22 NHS Priorities planning guidance:
- Early cancer diagnosis
- Hypertension (stroke mitigations)
- Chronic respiratory disease
- Annual health checks for people with serious mental illness
- Continuity of maternity carer plans.
A potentially useful feature of the programme is the development of a ‘health inequalities improvement dashboard’,
to include indicators/metrics applicable to the five clinical focus areas and data on ethnicity and deprivation. The idea is to enable systems to measure, monitor and gain insight to make improvements to narrow health inequalities in their regions. The risk is that gathering this data could be a sizeable task which may conflict with the intelligence needs already identified locally – so each ICS will have to prioritise with care. The PHM Flatpack produced by NSHE, Public Health England (PHE) and NHS Digital is a rich and informative guide to help ICSs on their PHM journey. It can be used effectively at ‘place’ and neighbourhood levels, adding considerable value to community development, prevention and care re-design initiatives. It can also prove useful for systems who are more mature, but with gaps in capabilities, looking for short-term fixes.
7. Driven by Data – or Humans?
For any ICS, a rich understanding of the root causes of health inequalities in their geography is increasingly regarded as essential, and rightly so. Collating it jointly can strengthen the collaboration between NHS organisations and local authorities, and shed immediate light upon where the opportunities to improve preventative healthcare are. Until that classic numerical system performance data is accompanied by the qualitative data available from co-production with citizens it won’t provide the full picture of how population behaviour change is achieved – but it’s a worthwhile place to start.
Written in collaboration with Keith Burnett, Health and Social Care Consultant and Change Enabler
Our Work
Our Services